Initial pledge per QAP, storage-provider returns and the growth condition





Abstract
At the snapshot inputs, new pledge is about 8,251 FIL per QA-PiB, versus a legacy-fleet average of 5,223. The FIP-0081 simple term accounts for about 86% of consensus pledge. It rises as circulating supply grows or QAP shrinks. Return on pledge is only approximately independent of QAP because the baseline term remains. Holding the snapshot fixed gives a gross annual FIL return near 21.2% at w₁ = 1 and 10.6% at w₁ = 0.5, or 20.5% and 9.9% after the illustrative new-sector fee. Ten percent borrowing is a scenario assumption. The later price table is a gross reward frontier before sector fees and pledge interest; it is not the break-even price for a fully financed provider. The $9.8M annual reward reduction is a reference allocation comparison, not a forecast of the ramp-end income loss.
1. Pledge per QAP: decomposition
After the FIP-0081 ramp completed, the initial pledge for QA power q (actors/miner/src/monies.rs::initial_pledge_for_power) is
ip per QA-PiB = 0.21CS / max(B, Q) + 0.09CS / Q + 20R / Q
Initial pledge = sector QA-PiB × ip; Q and B are in PiB and R is FIL/day.
Inputs from the Filecoin Data Portal (late October 2026): CS = 922.35M FIL, Q̂ = 11,857 PiB, raw power 1,300 PiB, R_day = 56,873 FIL, and the baseline at 6.03 years after genesis, B = 2.5057 EiB · 2^6.03 = 167,800 PiB. Per QA-PiB:
| Term | Formula | FIL per QA-PiB | Share |
|---|---|---|---|
| Baseline | 0.21 · CS / B | 1,154 | 14.0% |
| Simple | 0.09 · CS / Q̂ | 7,001 | 84.8% |
| Storage | 20 R / Q̂ | 96 | 1.2% |
| Total | 8,251 | 100% |
That is 0.252 FIL per 32 GiB of QA, or 2.52 FIL ($2.37) for a 32 GiB sector at 10x quality. Dividing the supplied 61.93M FIL collateral measure by 11,857 QA-PiB gives 5,223 FIL per QA-PiB, about 63% of the new-pledge requirement. That ratio is a stock comparison. If the measure includes locked miner rewards, it overstates initial pledge alone and cannot identify pledge on expiring sectors.
Why it trends up. Because Q̂ ≪ B, the simple term dominates and the pledge per QAP is approximately 0.09 CS/Q̂. Its log-derivative is
The supplied 30-day changes of +0.8% for CS and −3.9% for QAP imply roughly +4.7% in the dominant CS/Q pledge term. Extending that rate for a year gives about 74%, a sensitivity rather than a forecast. The 3.15% decline in reported locked collateral is consistent with net unlocking, but does not distinguish sector releases from reward vesting. Raw power also fell; inferred power disappearance is not a direct expiry count. FIP-0081 adds a simple CS/Q term that raises pledge per QAP as QAP contracts. With the earlier 30% baseline consensus term, the consensus component would be about 1,650 FIL per QA-PiB at these inputs; the storage component would be additional.
The financing channel can reinforce contraction. Expiries can release pledge, raising circulating supply; higher supply raises new pledge per unit of power, while a falling reward pool lowers FIL return on that pledge. Those incentives can discourage renewal. The snapshot does not establish the strength of this feedback or prove that it caused the observed contraction. Shrinking QAP also raises surviving sectors’ share of rewards.
2. Return on pledge and return on hardware
In the w₁ = 1 reference case, consensus income is R_day/Q̂ = 4.797 FIL per QA-PiB-day. A newly priced FIP-0100 sector fee at the snapshot supply is about 0.168 FIL per QA-PiB-day, or 3.5% of that income. Existing sectors can carry different activation-time fees. The following ratio deducts the illustrative fee before dividing reward by pledge:
With Q̂ ≪ B, the simple term dominates and return is approximately independent of QAP. Holding the snapshot inputs fixed gives 21.2% gross annual FIL return at w₁ = 1 and 10.6% at w₁ = 0.5. Deducting the illustrative new-sector fee gives 20.5% and 9.9%. This isolates the share change. It is not a prediction of the return roughly nine quarters later, when issuance, QAP, circulating supply and financing terms can differ.
FIL-on-FIL return on new pledge through the Solstice ramp, after the daily fee:
| Ramp position (quarters elapsed) | Consensus weight w₁ | FIL-on-FIL return |
|---|---|---|
| Unsplit reference | 1.00 | 20.5% |
| Q0 | 0.95 | 19.4% |
| Q2 | 0.85 | 17.3% |
| Q4 | 0.75 | 15.2% |
| Q6 | 0.65 | 13.0% |
| Q8 | 0.55 | 10.9% |
| Q9 onward (floor) | 0.50 | 9.9% |
Pledge and reward per QAP both have a dominant 1/Q term, so shrinking QAP does not by itself imply a falling FIL return on pledge. The independence is approximate, not exact. Reward decay, circulating supply and the consensus share also matter. Raising the FIL commitment per TiB raises financing needs, but an aggregate token supply figure does not establish that a particular provider can obtain a loan on suitable terms.
Return on hardware. The quantity that decides onboarding is reward per raw TiB, since hardware and operating cost scale with raw bytes. With quality multiplier κ:
| κ | w₁ | FIL per raw TiB-month | USD at $0.94 | After daily fee |
|---|---|---|---|---|
| 10 | 1.00 | 1.426 | $1.34 | $1.29 |
| 10 | 0.50 | 0.713 | $0.67 | $0.62 |
| 1 (legacy CC) | 1.00 | 0.143 | $0.13 | $0.13 |
| 9.12 (fleet average) | 1.00 | 1.300 | $1.22 | $1.18 |
A 10x sector needs about 80.6 FIL of pledge per raw TiB, worth $75.8 at the reference price. Borrowing the entire amount at an assumed 10% annual FIL rate costs about $0.63 per TiB-month. This is a financing scenario, not an observed market-wide borrowing rate. The following table deducts the new-sector fee and pledge interest from rewards, leaving the margin available for hardware and operations:
| w₁ | No borrowing | 5% FIL loans | 10% FIL loans |
|---|---|---|---|
| 1.00 | $1.29 | $0.98 | $0.66 |
| 0.75 | $0.96 | $0.64 | $0.33 |
| 0.50 | $0.62 | $0.31 | −$0.01 |
At the Solstice floor a sector financed at 10% earns −$0.01 per raw TiB-month before any hardware cost. The break-even borrowing rate equals the FIL-on-FIL return, 9.9%.
3. The growth condition
For the gross reward frontier below, c means fixed USD hardware, power, space, bandwidth and operating costs per raw TiB-month. It excludes sector fees and pledge interest. With client income d, gross block revenue covers c when the following inequality holds. A financed provider instead requires p × (monthly FIL reward − sector fee in FIL − annual FIL interest rate × pledge / 12) + d ≥ c. If the net FIL term is negative, a higher FIL price alone cannot produce a positive hardware margin.
The chart sweeps assumed fixed USD costs from $1 to $8 per raw TiB-month. These are sensitivities, not measured provider costs. Retail cloud tariffs are customer prices and do not establish an operator’s cost. The sector-fee and financing examples above must be added separately.
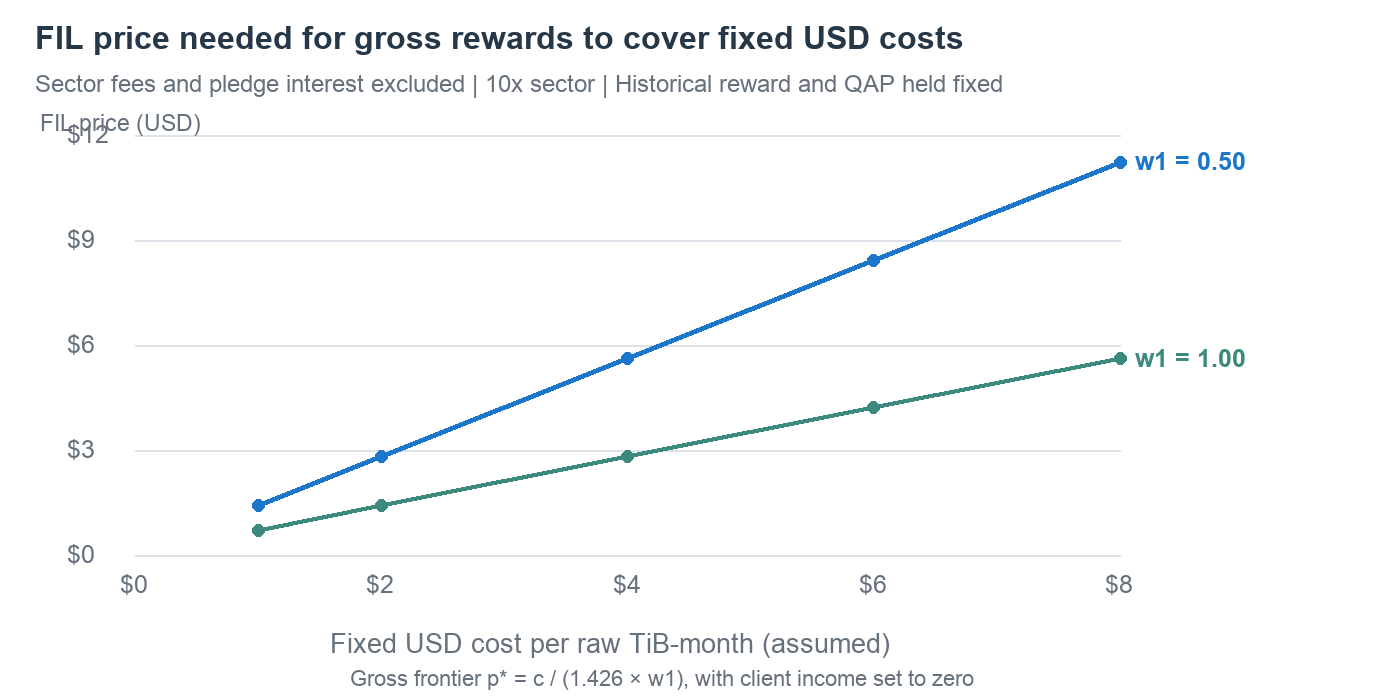
Gross reward frontier using the historical inputs; fixed USD cost axis is assumed. Sector fees and pledge financing are excluded.
| Cost c per raw TiB-month | p* at w₁ = 1.0 | p* at w₁ = 0.5 | Price rise from $0.94, w₁ = 0.5 | Deal income d to break even at $0.94, w₁ = 0.5 |
|---|---|---|---|---|
| $2 | $1.40 | $2.81 | +199% | $1.33 per TiB-month |
| $4 | $2.81 | $5.61 | +497% | $3.33 per TiB-month |
| $6 | $4.21 | $8.42 | +796% | $5.33 per TiB-month |
The supplied snapshot has onboarding of 0.27 PiB/day and a 4.9% raw-power decline over 30 days. Combining onboarding and the power change gives roughly 2.4 to 2.5 PiB/day of power disappearance, which can include faults and terminations as well as expiry.
At fixed costs above $1.34 per raw TiB-month, the w₁ = 1 reference reward does not cover those costs at $0.94. The 50% floor reduces the gross reward to $0.67. This is consistent with pressure on provider margins, but contraction alone does not identify costs or prove causation. Financing and sector fees reduce the available margin further.
At the reference issuance, the 50-point reward shift is about $9.8M a year. Replacing it with provider revenue would require that amount to reach providers, about 68 times the $144K gross payment run rate used in the snapshot. Gross service payments are not guaranteed to reach providers in full. Using the actual fleet-average quality ratio gives a lost reward near $0.61 per raw TiB-month and the same $9.8M total; applying the 10x-sector figure to the mixed fleet overstates the total. The final $3.66M quarterly gate corresponds to $14.6M annualized volume, but volume qualification and revenue distribution remain separate from provider profit.
4. Discussion
Provider returns depend on financing terms, operating costs and client income.
Pledge per QAP and return on pledge must be separated. The leading 1/Q terms largely cancel in the FIL return, while issuance decay, growing circulating supply and a lower consensus share reduce it. FIL price affects dollar margins, not the FIL-on-FIL ratio itself. At the frozen inputs, the after-fee floor return is about 9.9%, slightly below the assumed 10% financing rate. This result does not apply to a provider with a lower rate, unborrowed pledge or additional client revenue.
A provider needs a positive net margin after hardware, operations, fees and financing. The $2.81 to $8.42 price range at the 50% floor covers only the assumed $2 to $6 fixed USD cost range before fees and interest. It cannot be used as a financed-provider break-even. With 10% FIL loans, the modeled floor reward barely covers interest before hardware; client revenue or cheaper finance would then be required.
The growth condition can be written as a single inequality in the three levers:
Solstice reduces the consensus allocation while funding services intended to attract paid usage. It does not guarantee compensating provider income. The final gate’s volume is large enough to exceed the $9.8M annualized reference reward shift, but that is only a scale comparison. Article 4 tests whether a larger quality multiplier can alter individual margins without increasing the reward pool.
Shared data snapshot (Filecoin Data Portal, late October 2026)
| Quantity | Value |
|---|---|
| Circulating supply | 922.35M FIL |
| Pledge collateral | 61.93M FIL (6.71% of circulating) |
| Raw byte power | 1,300 PiB |
| Quality-adjusted power | 11,857 PiB |
| Onboarding | 0.27 PiB/day |
| Block reward | 56,873 FIL/day |
| Burn | 1,661 FIL/day |
| FIL price | $0.94 |
| Filecoin Pay gross payment run rate | $136K to $144K per year |
| Filecoin Pay network fee ARR | $681 |
| Baseline power at 6.03 years | 167,800 PiB |
| Vesting | Ended October 15, 2026 (about 185,000 FIL/day before) |
Code basis is builtin-actors v19.0.1 and Lotus v1.37.0. Onboarding uses raw bytes. Costs of $1 to $8 per raw TiB-month and FIL borrowing rates of 5% to 10% are scenario assumptions, not audited provider costs or executable loan quotes. Dollar and annualized results hold the stated issuance, price and supply fixed unless a time path is specified. The shared snapshot is historical; this review does not replace it with November market data.
The Filecoin economics series
- The Solstice volume gate: subsidy, inflation and the calibration of targets
- Initial pledge per QAP, storage-provider returns and the growth condition
- Conditions for a daily contraction of circulating supply
- Raising the quality multiplier from 10x to 50x: an idea exploration
Source links
Filecoin Data Portal numbers and metric definitions
FIP-0118 reward split, eligible volume and gate timing
FIP-0081 initial pledge decomposition
FIP-0100 sector fee and circulating-supply discussion
builtin-actors v19.0.1 miner pledge and fee code
Discuss This Article With AI
Get instant analysis and insights from leading AI assistants
How We Can Help
Interested in similar solutions for your project? Explore our related services: